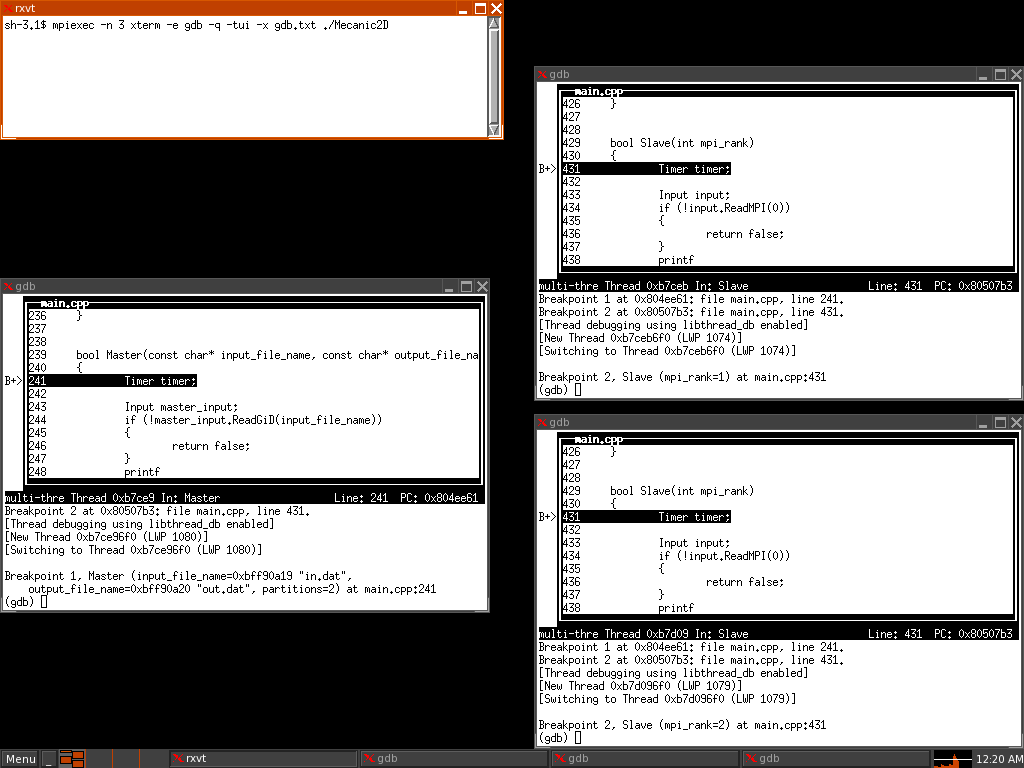
Screenshot of this example
To debug MPI programs could be harsh, several processes runing at the same time, loads of information, synchronization between processes, etc.
There are comercial solutions to do this task:
But it could be done with free tools like the GNU Debugger (GDB) and Microsoft Visual Studio Express Edition.
These tricks will work for MPI programs with just a few processes (probabily less than five) running in the same computer. That could be good enough for concept testing.
First you need to create a file to contain GDB startup commands. For example, the file "gdb.txt" will set breakpoints in "Master" and "Slave" functions, also will run the program using "in.dat out.dat" as arguments.
b Master
b Slave
r in.dat out.dat
The command line will be:
mpirun -n 3 xterm -e gdb -q -tui -x gdb.txt ./Mecanic2D
This will execute three processes, each one in a different terminal (xterm) and will start debuging "Mecanic2D" with gdb".
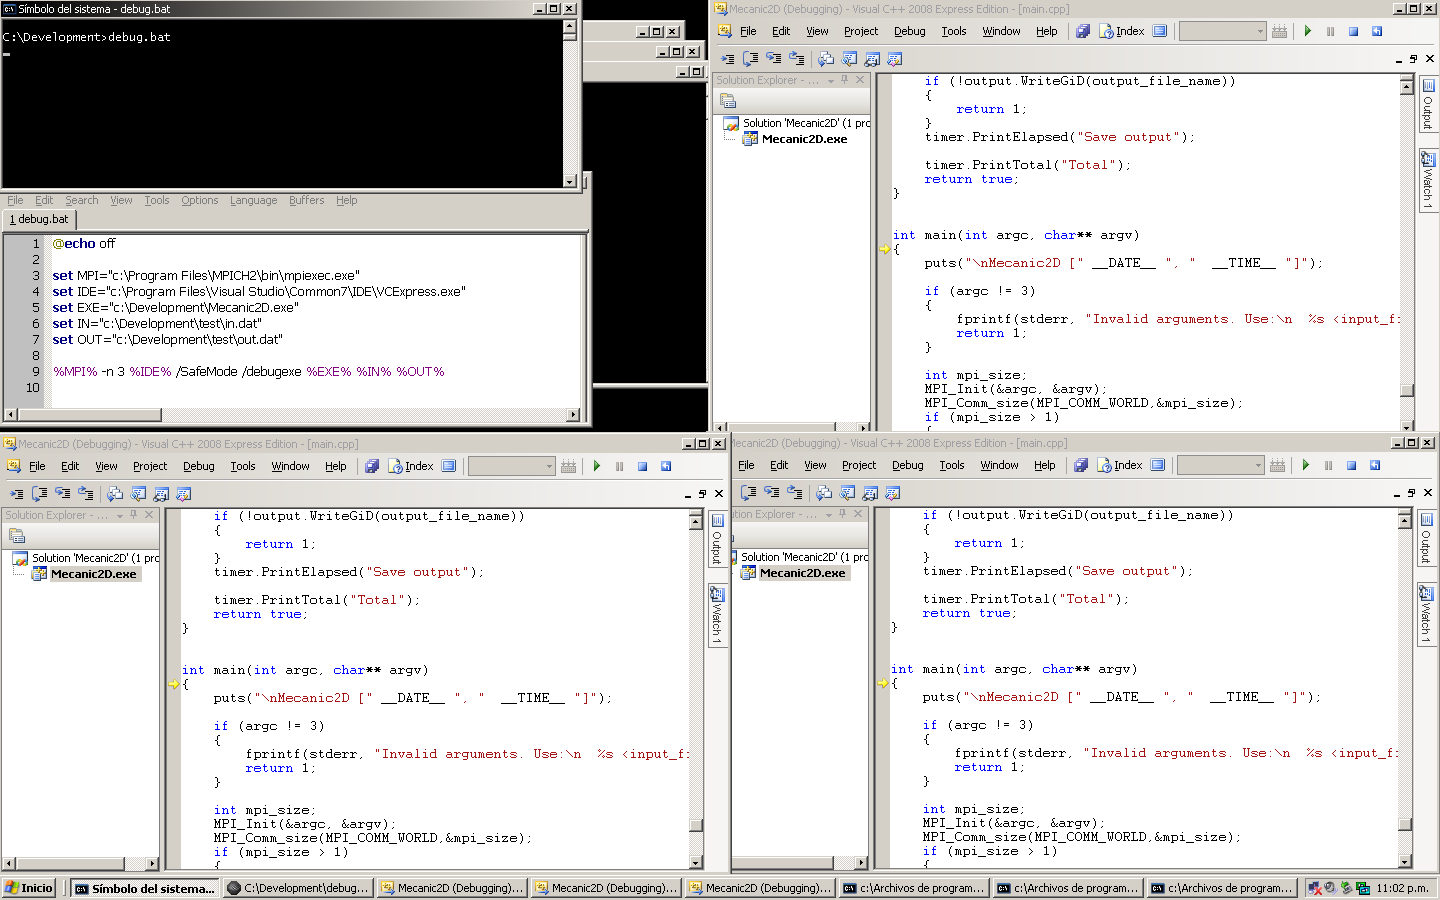
Screenshot of this example
In order to debug using the source code, you must have the source code of your project located where you built it.
First you should create a batch file containing the location of "mpiexec.exe", your executable and extra parameters. This is an "debug.bat" example:
@echo off
set MPI="c:\Program Files\MPICH2\bin\mpiexec.exe"
set IDE="c:\Program Files\Visual Studio\Common7\IDE\VCExpress.exe"
set EXE="c:\Development\Mecanic2D.exe"
set IN="c:\Development\test\in.dat"
set OUT="c:\Development\test\out.dat"

%MPI% -noprompt -localroot -l -n 3 %IDE% /SafeMode /debugexe %EXE% %IN% %OUT%
Program database file (.pdb) must be in the same directory as the executable.
Screenshot of this example
If you want to keep breakpoints you should save the solution created by Visual C++ before closing the debbuging program. For better results, save this solution in the same directory as the program executable. A solution file (.sln) will be created and also an solution user options file (.suo), this one will contain breakpoints information. To retreive this before debugging you should edit the "debug.bat" file like this:
@echo off
set MPI="c:\Program Files\MPICH2\bin\mpiexec.exe"
set IDE="c:\Program Files\Visual Studio\Common7\IDE\VCExpress.exe"
set EXE="c:\Development\Mecanic2D.exe"
set IN="c:\Development\test\in.dat"
set OUT="c:\Development\test\out.dat"
set SLN="c:\Development\Mecanic2D.sln"

%MPI% -n 3 %IDE% %SLN% /SafeMode /debugexe %EXE% %IN% %OUT%
The SLN variable sould point to the solution file created when debugging. I suggest not to use the solution file that you are using in your project development, because it already has stored information that could overrule debug parameters passed by the batch file. Also you could get messages telling you that IntelliSense information will not be available.
If you have any comments or suggestions to improve this document, please do not hesitate, contact me:

Last modification: March 17, 2009
![]()